 |
| Home | Teacher | Parents | Glossary | About Us | |||||||||||
|
|
|||||||||||
|
|
Let's draw the graph of this equation.
![]()
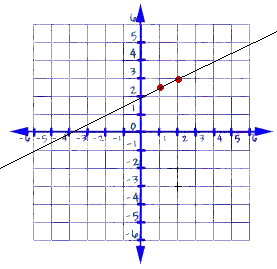
One method we could use is to find the x and y values of two points that satisfy the equation, plot each point, and then draw a line through the points. We can start with any two x values we like, and then find y for each x by substituting the x values into the equation. Let's start with x = 1.
|
Value of x
|
|
Value of y
|
|
1
|
 |
2.5
|
|
2
|
 |
3 |
Let's plot these points and draw a line through them.

Graphing Using Slope and Y-Intercept
There's
another way to graph an equation using your knowledge of slope and y-intercept.
Look at the equation again.
![]()
We can find the slope and y-intercept of the line just by looking at the equation: m = 1/2 and y intercept = 2.
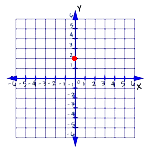
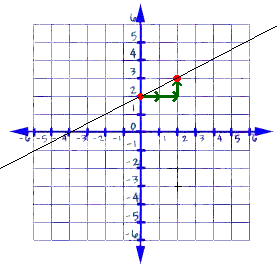
Just by looking at these values, we already know one point on the line! The y-intercept gives us the point where the line intersects the y-axis, so we know the coordinates of that point are (0, 2), since the x value of any point that lies on the y axis is zero.

To find the second point, we can use the slope of the line. The slope is ½ , which gives us the change in the y value over the change in the x value. The change in the x value, the denominator, is 2, so we move to the right 2 units.
The change in the y value, the numerator, is positive one. We move up one unit. This gives us the second point we need. Now we can draw the line through the points.

This is the exact same line we found using the first method. Do you see that it's quicker and easier to use the y-intercept and the slope? You can use either method to graph the line, depending on what information you have about the line and its equation.
| Homework Help | Algebra | Graphing Equations and Inequalities | |||
|
|
|||||||||||||||||||||||||||||||||||||||||||||||||||